The Ultimate AP Statistics Score Calculator: Predict Your 1–5 Score
AP Statistics Score Calculator: Predict Your 1–5 Score
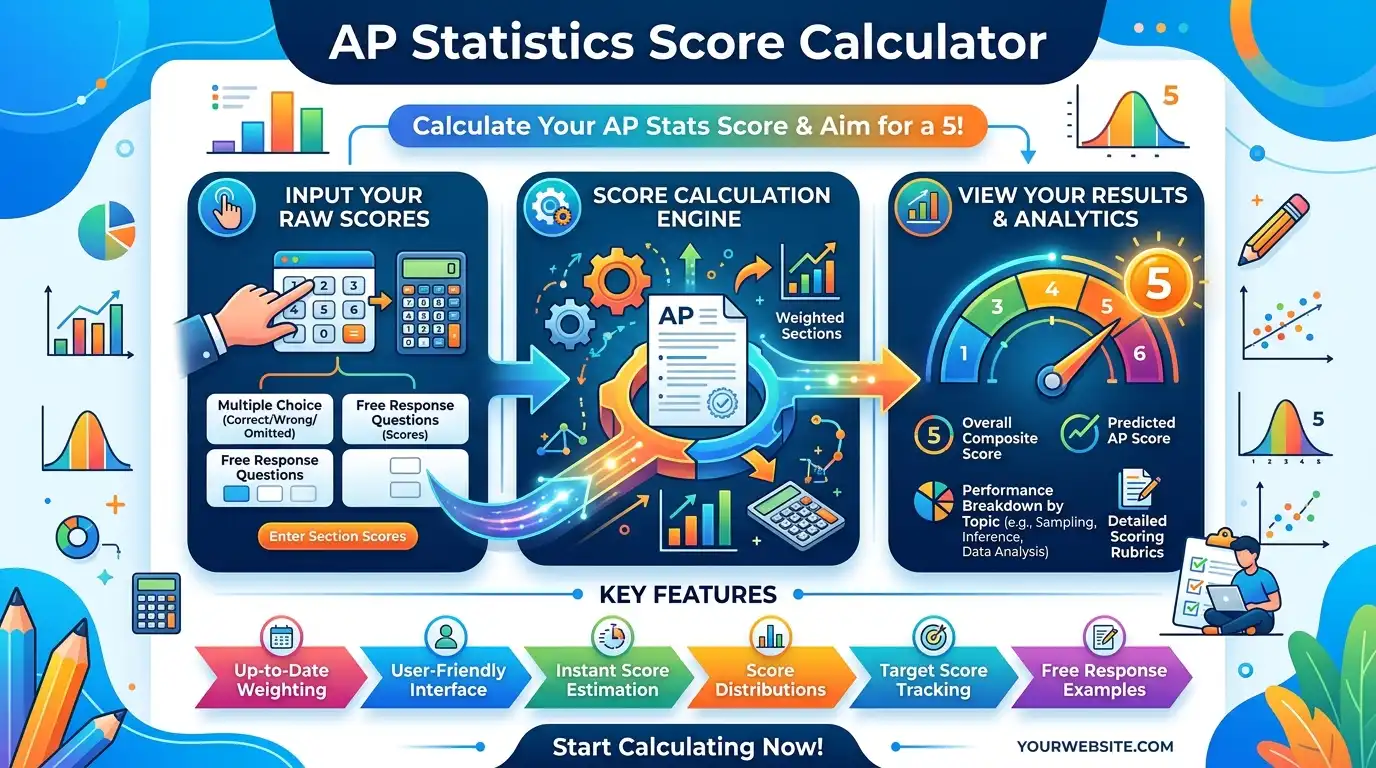
The AP Statistics Score Calculator estimates a 1–5 AP score from practice-test performance. Enter your multiple-choice and free-response results to see an estimated composite and score range. Use the result for study planning, not as an official College Board score.
2026 Free-Response Scores
Enter the points earned on each free-response question.
How This AP Statistics Score Calculator Works
The calculator converts your multiple-choice and free-response performance into percentages. Each section contributes up to 50 points to the estimated composite.
FRQ Contribution = (FRQ Points ÷ Maximum FRQ Points) × 50
Estimated Composite = MCQ Contribution + FRQ Contribution
For the 2026 format, there are 40 multiple-choice questions and six free-response questions. Questions 1–5 are scored from 0–4 points, while Question 6 is scored from 0–12 points.
Beginning with the May 2027 exam, AP Statistics changes to 42 multiple-choice questions. It also changes to four 10-point free-response questions. Both sections remain equally weighted.
For current official information, see College Board’s AP Statistics Exam page .
Step-by-Step AP Statistics Score Example
Suppose a student gets 28 of 40 multiple-choice questions correct. Their free-response scores are 3, 3, 3, 2, 3, and 8, for a total of 22 out of 32.
- Multiple-choice percentage: 28 ÷ 40 = 70%.
- Weighted MCQ contribution: 70% × 50 = 35 points.
- Free-response total: 3 + 3 + 3 + 2 + 3 + 8 = 22 points.
- Free-response percentage: 22 ÷ 32 = 68.75%.
- Weighted FRQ contribution: 68.75% × 50 = 34.375 points.
- Estimated composite: 35 + 34.375 = 69.375, or approximately 69.4/100.
The calculator compares the composite with its unofficial planning ranges. If your result is near a boundary, review lost points instead of treating one point as guaranteed.
What Affects Your AP Statistics Score?
AP Stats Calculator Multiple-Choice Accuracy
Multiple-choice performance matters because this section represents half of the exam. Moving from 28 to 32 correct answers on a 40-question test raises accuracy from 70% to 80%.
AP Statistics Free-Response Performance
Free-response questions reward statistical reasoning, not only final answers. Points can be lost for incorrect methods, missing conditions, arithmetic errors, or unclear interpretations.
AP Statistics Exam Format
The exam version matters. The 2026 format uses 40 multiple-choice questions and six FRQs. The May 2027 exam changes to 42 multiple-choice questions and four 10-point FRQs.
Statistical Communication
Strong AP Statistics responses explain conclusions in context. A calculation alone may not receive full credit if the statistical meaning is not clearly connected to the scenario.
Inference and Conditions
Inference questions may require appropriate methods and conditions. Check randomness, independence, normality, large-count requirements, and study design when reviewing missed points.
Using an AP Stat Calculator Correctly
Enter raw practice scores accurately. Do not count attempted questions as correct. Use the actual points awarded on each FRQ when calculating your practice result.
AP Statistics Score Calculator Estimated Ranges
The table below is an unofficial planning model. These ranges should not be treated as permanent College Board score cutoffs.
| Estimated AP Score | Planning Composite | What It Suggests |
|---|---|---|
| 5 | 71–100 | Very strong practice performance |
| 4 | 56–70 | Strong practice performance |
| 3 | 44–55 | Solid qualifying-level planning range |
| 2 | 34–43 | Additional preparation recommended |
| 1 | 0–33 | Review core statistical concepts |
These ranges are for practice planning only. The actual AP score comes from College Board’s scoring and score-setting process.
Frequently Asked Questions About AP Statistics Score Calculators
How does an AP Statistics Score Calculator work?
It converts multiple-choice and free-response performance into weighted contributions. Each section contributes 50% of the estimated composite before the result is compared with an unofficial planning scale.
How many points do I need for a 5 on AP Statistics?
This calculator uses 71 or more composite points as its unofficial planning range for an estimated 5. It is not a permanent official College Board cutoff.
How much are multiple choice and FRQs worth on AP Statistics?
Multiple choice and free response are each worth 50% of the AP Statistics exam score. The calculator converts each section into a 50-point contribution.
Can I use this AP Stats calculator for a practice exam?
Yes. Enter your correct multiple-choice answers and actual FRQ points. Then select the exam format that matches your practice test.
Why do different AP Statistics calculators give different results?
Third-party calculators can use different historical assumptions, conversion methods, rounding rules, and score ranges. No third-party calculator guarantees an official AP score.
What should I do if my AP Statistics score is close to a boundary?
Review exactly where you lost points. Identify recurring weaknesses in multiple choice and FRQs. Then practice those areas under timed conditions.
Does a higher AP Statistics score guarantee college credit?
No. Colleges and universities set their own AP credit and placement policies. Check the current policy of the college you plan to attend.
Is this AP Statistics score calculator official?
No. CalculatorSuiteHub’s AP Statistics Score Calculator is an independent planning tool. It cannot replace an official AP score report.
Related Math & Science Calculators
Official AP Statistics Resources
AP Statistics Exam — College Board
AP Statistics Revisions — College Board
AP Statistics Past Exam Questions — College Board
Author: Asrar Ahmad · CalculatorSuiteHub.com

Asrar Ahmad
Founder of CalculatorSuiteHub.com and Rankify SEO & AI Agency. Specializes in SEO, technical content writing, WordPress development, and AI-powered digital solutions. Builds accurate calculators and helps businesses grow online.