Stem and Leaf Plot Calculator 2026
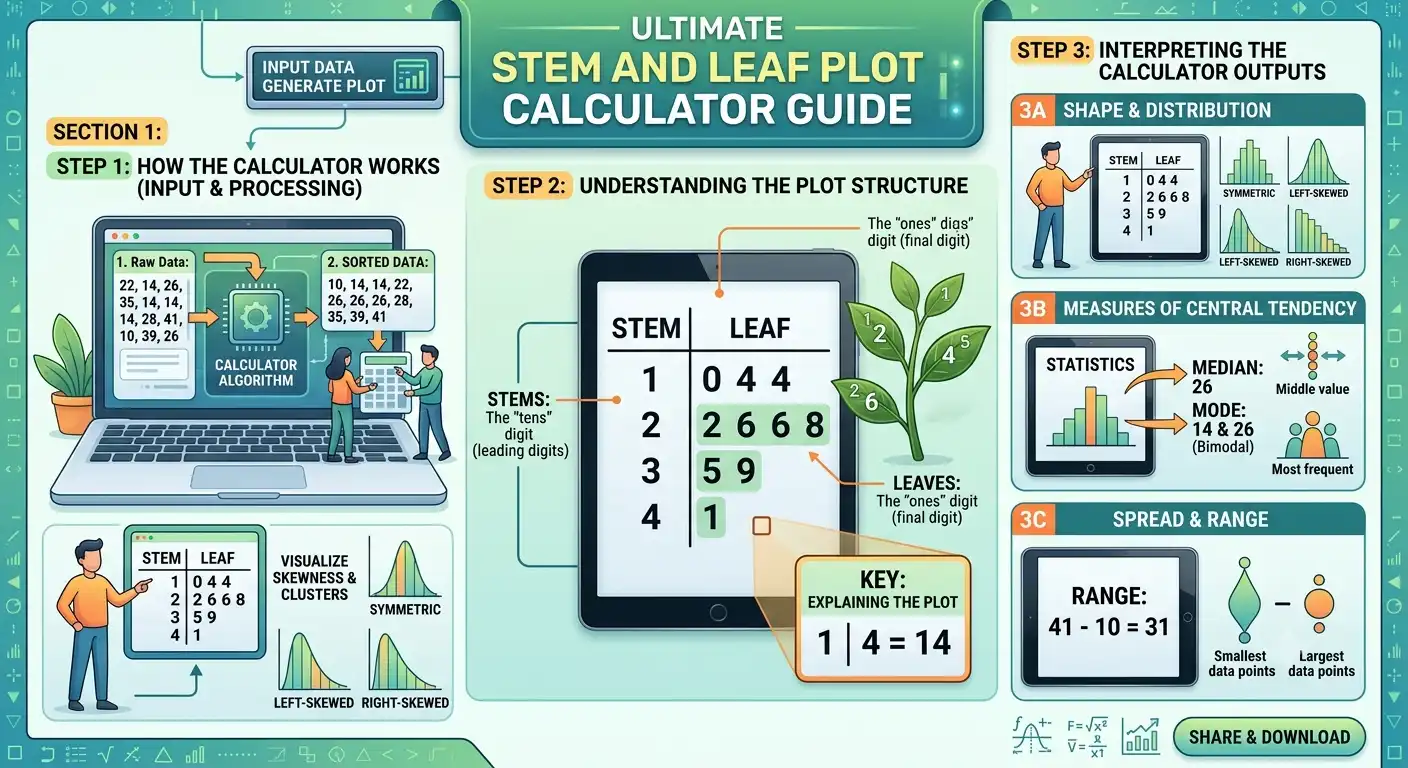
Stem and Leaf Plot Calculator
This stem and leaf plot calculator turns a raw list of numbers into an accurate stemplot in seconds — and unlike most free stem leaf plot calculator tools online, this one automatically handles decimals and negative values instead of asking you to rescale your data by hand first. Paste your dataset below, click calculate, and you’ll get the plot, the key, and the core statistics (mean, median, mode, range) together on one screen.
Build Your Stem and Leaf Plot
How This Calculator Works — Formula & Explanation
A stem-and-leaf plot splits every number in a dataset into two parts: a stem (all digits except the last one) and a leaf (the final digit). This stem leaf plot calculator groups every value by its stem, sorts the leaves within each row from smallest to largest, and lines everything up so you can read the shape of your data at a glance — without losing a single original value, which is what makes it more informative than a plain histogram.
Stem | Leaf, read as: Stem × 10 + Leaf = Original Value
Example: a stem of 3 and a leaf of 7 represents the number 37. For decimal data, the same tool reads one decimal place, so a stem of 5 and a leaf of 2 represents 5.2.
Step-by-Step Example Calculation
Scenario: A teacher records 12 quiz scores: 42, 14, 22, 16, 2, 15, 8, 27, 6, 15, 19, 48.
- Sort the data: 2, 6, 8, 14, 15, 15, 16, 19, 22, 27, 42, 48.
- Split each value into stem and leaf: 2 → stem 0, leaf 2; 14 → stem 1, leaf 4; 42 → stem 4, leaf 2, and so on.
- Group by stem: stem 0 gets leaves 2, 6, 8; stem 1 gets leaves 4, 5, 5, 6, 9; stem 2 gets leaves 2, 7; stem 4 gets leaves 2, 8.
- Calculate the mean: (2+6+8+14+15+15+16+19+22+27+42+48) / 12 = 19.5.
- Calculate the median: with 12 values, average the 6th and 7th sorted values: (15+16)/2 = 15.5.
That’s exactly what the calculator above returns with its default values — paste your own dataset to get your specific plot and statistics.
What Affects Your Stem and Leaf Plot Calculator Result
Stem and Leaf Plot Calculator for Decimals
Most free stem leaf plot calculator tools flatly refuse decimal input or ask you to multiply every value by 10 yourself first. This calculator detects decimal data automatically and reads the leaf as the first decimal digit — so 5.2 becomes stem 5, leaf 2 — with no manual rescaling required.
Stem and Leaf Plot Calculator for Negative Numbers
Negative values are common in temperature logs, elevation changes, and profit/loss data, yet many competing tools break or ignore the sign entirely. This calculator keeps negative stems in correct numeric order (for example, −3 sorts before −1), so the plot’s overall shape still reads correctly left to right.
Back-to-Back (Double) Stem and Leaf Plots
When comparing two related groups — like two classes’ test scores — a back-to-back plot shares one stem column with leaves for Group A on the left and Group B on the right. Run this calculator once per group, then align the two plots on matching stem values to compare distributions side by side.
Choosing Between a Stem and Leaf Plot vs. a Histogram
A stemplot keeps every original data value visible, which is ideal for datasets under roughly 50–75 points. Beyond that, rows get long and hard to scan — a histogram, which groups values into bins and shows only the count per bin, usually communicates the shape more clearly for larger datasets.
Reading the Key Correctly
Every stem-and-leaf plot needs a key (for example, “1 | 4 = 14”) because a stem of “1” is meaningless without knowing the leaf’s place value. This calculator generates that key automatically underneath the plot, adjusting it for decimal data so it always matches what’s actually displayed.
Typical Dataset Sizes and When to Use This Tool
| Use Case | Typical Data Size | Best Display Type |
|---|---|---|
| Classroom quiz/test scores | 10–35 values | Stem-and-leaf plot (this tool) |
| Sports statistics (e.g., points per game) | 15–60 values | Stem-and-leaf plot |
| Temperature or weather logs | 20–100 values, often negative | Stem-and-leaf plot with signed stems |
| Survey responses (Likert-style, 1–2 decimals) | 30–150 values | Stem-and-leaf plot with decimal leaves |
| Large research datasets | 150+ values | Histogram or frequency table instead |
Frequently Asked Questions
What is a stem and leaf plot calculator used for?
A stem and leaf plot calculator organizes a raw list of numbers into stems (leading digits) and leaves (the last digit), instantly showing the data’s distribution while keeping every individual value visible — unlike a histogram, which only shows counts per bin.
Does this stem leaf plot calculator handle decimal numbers?
Yes. If any value in your dataset has a decimal point, the calculator automatically reads the leaf as the first decimal digit — for example, 6.8 is shown as stem 6, leaf 8 — and updates the key underneath the plot to match, with no manual rescaling needed.
How does the calculator handle negative numbers?
Negative values keep their sign on the stem and are sorted in correct numeric order, so a value like −21 appears as stem −2, leaf 1, positioned before less-negative stems. This keeps datasets like temperature logs or profit/loss records accurate.
What’s the difference between a stem and leaf plot and a histogram?
A stem-and-leaf plot preserves every original data value while showing its shape, making it ideal for small to mid-sized datasets. A histogram groups data into bins and only shows the frequency count per bin, which scales better for very large datasets but loses the individual values.
Can I make a back-to-back stem and leaf plot with this tool?
Run the calculator separately for each group’s data, then place the two resulting plots side by side, sharing a single central stem column — leaves for one group go left, leaves for the other go right. This is the standard way to compare two related datasets visually.
Why does my stem and leaf plot need a key?
A key (such as “1 | 4 = 14”) tells readers the place value represented by each stem and leaf, which is essential since a stem of “1” is ambiguous on its own — it could mean 10s, 100s, or even tenths depending on the dataset’s scale.
What’s the maximum dataset size this stem leaf plot calculator 2026 version supports?
The tool works reliably up to a few hundred values, though stem-and-leaf plots become visually crowded past roughly 75–100 data points. For larger datasets, this calculator’s own guidance above recommends switching to a histogram for clearer readability.
How is the mode calculated if there’s a tie?
If two or more values share the highest frequency, the calculator lists all of them as modes (a bimodal or multimodal dataset). If every value appears exactly once, the result correctly shows “No Mode” rather than forcing a false single answer.
Related Calculators
Coming soon on CalculatorSuiteHub — links will activate once each page is published and verified.
Formula reference: NIST/SEMATECH e-Handbook of Statistical Methods · Khan Academy — Statistics & Probability

Asrar Ahmad
Founder of CalculatorSuiteHub.com and Rankify SEO & AI Agency. Specializes in SEO, technical content writing, WordPress development, and AI-powered digital solutions. Builds accurate calculators and helps businesses grow online.